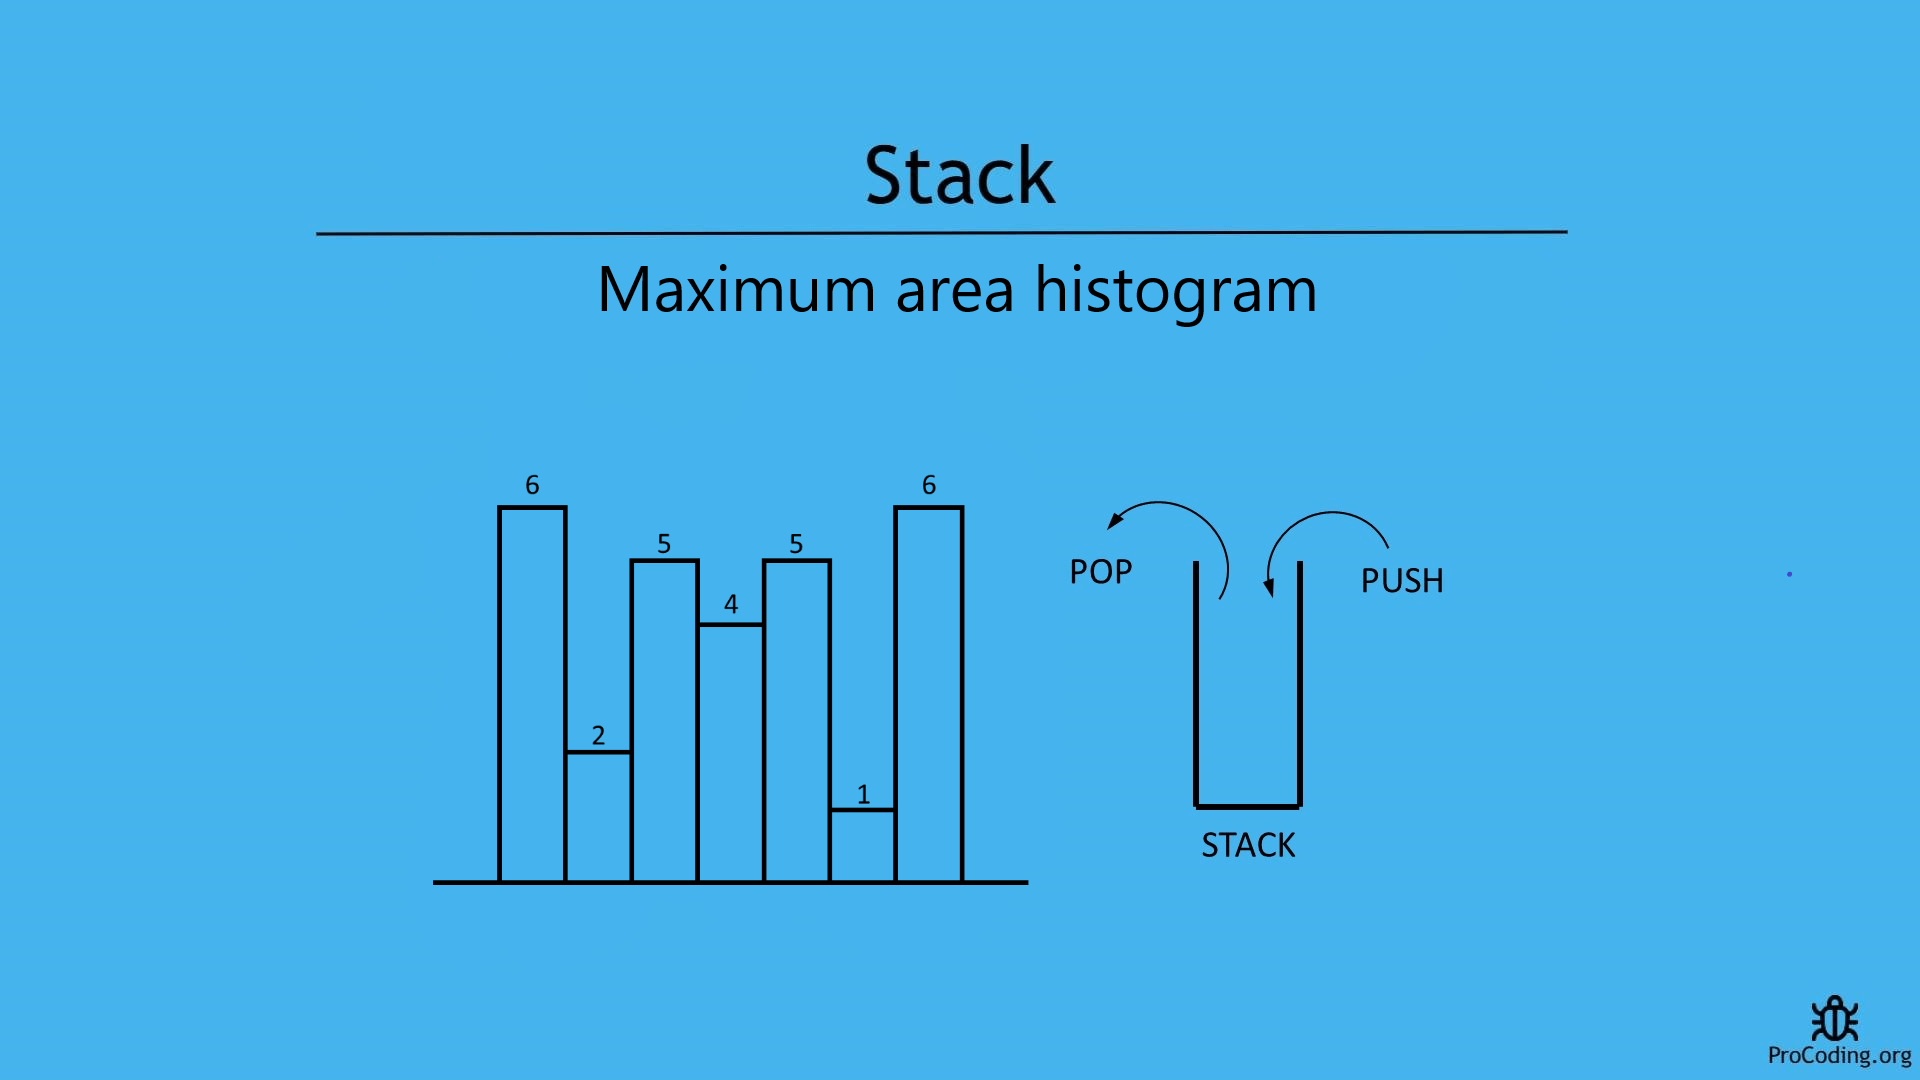
Maximum area histogram
Write a program to find the maximum area under histogram or largest rectangle in a histogram. It's optimized solution can be obtained using stack.
Problem
Find the largest rectangular area possible in a given histogram where the largest rectangle can be made of a number of contiguous bars. Assume that all bars have same width and the width is 1 unit.
Given n non-negative integers representing the histogram's bar height where the width of each bar is 1, find the area of largest rectangle in the histogram.
For example, consider the following histogram. Here, area can be calculated over many bars.
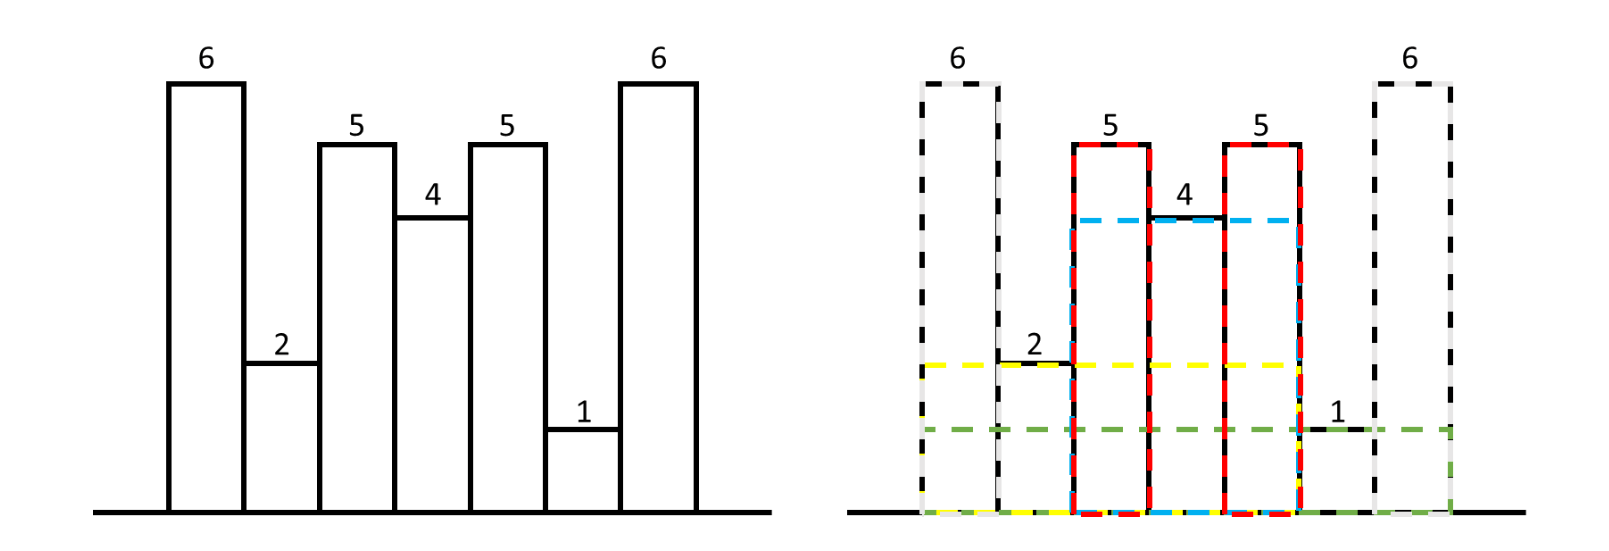
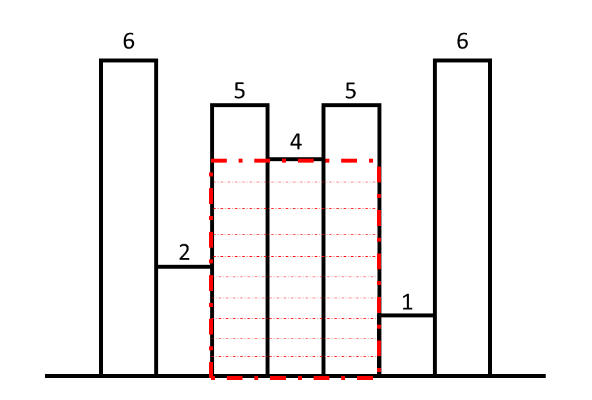
But, the maximum area is under the highlighted bars i.e, 4 * 3 = 12.
This is what we have to calculate.
Example -
Input: [2, 1, 5, 6, 2, 3]
Output: 10

Input: [6, 2, 5, 4, 5, 1, 6]
Output: 12
We will see following two ways to solve the problems
Brute-force approach (using nested loops)
In this approach we will nested loops. Outer loop will iterate over all the array items and two inner loop will iterate over all the next and previous elements of currently pointed by outer loop. Inner loops will check, smaller element in the left and right and then area of rectangle can be calculated and compared.
Python
def max_area_histogram(arr):
    max_area = 0

    for i in range(len(arr)):
        for j in range(i, len(arr)):
            min_height = min(arr[i], arr[j])
            for k in range(i, j):
                min_height = min(min_height, arr[k])

            max_area = max(max_area, min_height * ((j - i) + 1))
    return max_area


arr = [6, 2, 5, 4, 5, 1, 6]
print(max_area_histogram(arr))
JavaScript
function maxAreaHistogram(arr) {
    let maxArea = 0;

    for (let i = 0; i < arr.length; i++) {
        for (let j = i; j < arr.length; j++) {
            minHeight = Math.min(arr[i], arr[j]);
            for (let k = i; k < j; k++) {
                minHeight = Math.min(minHeight, arr[k]);
            }
            maxArea = Math.max(maxArea, minHeight * ((j - i) + 1));
        }
    }
    return maxArea;
}

arr = [6, 2, 5, 4, 5, 1, 6];
console.log(maxAreaHistogram(arr));
Output
[-1, -1, 4, -1, 2]
Although, we have solved this problem using just loops but this is not an optimized solution. Because time complexity of this solution is O(n^3).
Using stack
If we observe the problem, for every bar we have to check the index of nearest smaller to left and nearest smaller to right because if we can find these two parameters then we got the width of that area under which maximum area resides by simply subtracting these parameters.
For better understanding check these problems Nearest smaller to left and Nearest smaller to right and for finding index go through Stock span problem.
For example, consider the following diagram
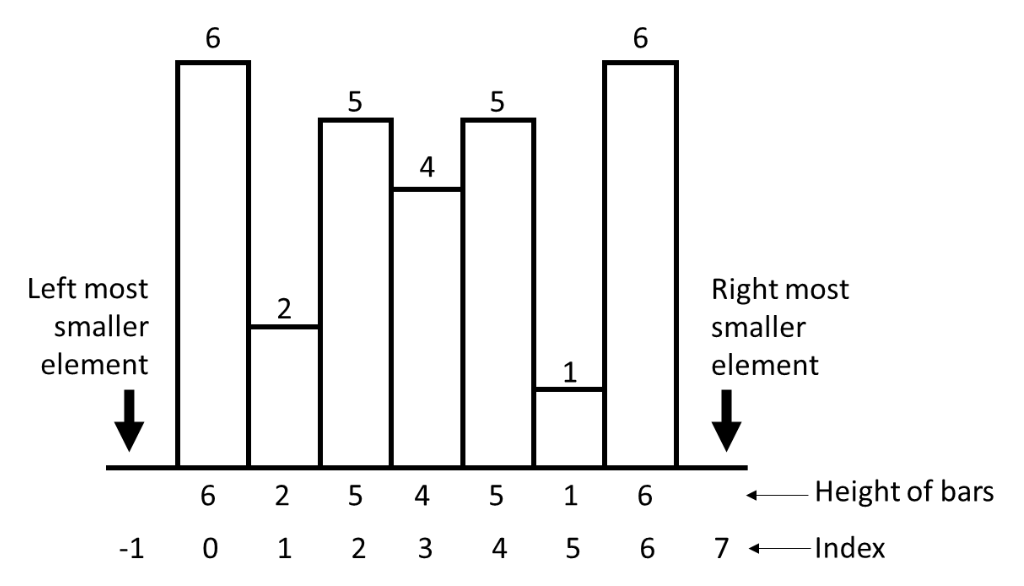
To make our calculation easier consider that left most smallest element is at -1 and right most smallest number is at index equal to length of array (here 7) then only we can subtract the width and get the appropriate value.
For index 3 having height 4, index of nearest smaller to left is 1 and nearest smaller to right is 5.
Now, subtract nearest smaller to left from nearest smaller to right and extra 1 because we are taking two extra bars from both sides i.e., 5 - 1 - 1 = 3.
So, 3 will be the width of total bars or area which can be covered by the index 3 bar having height 4 because we have assumed that width of each bar is of 1 unit.
Now, we can calculate area under the span of this bar i.e., 4 * 3 = 12.
So, we can say that
WIDTH = NEAREST SMALLER TO RIGHT - NEAREST SMALLER TO LEFT - 1
And, then we can calculate the area because the height is already known.
We, have to do this for each bar and store the values in an array then find the maximum value among them.
Program
Python
class Stack:
    def __init__(self):
        self.stack = []

    def isEmpty(self):
        return len(self.stack) == 0

    def push(self, num):
        self.stack.append(num)

    def pop(self):
        if self.isEmpty():
            raise Exception('Stack Underflow')
        return self.stack.pop()

    def peek(self):
        if self.isEmpty():
            return None
        return self.stack[-1]

def nearestSmallerToRight(arr):
    stack = Stack()
    result = []

    for i in range(len(arr)-1, -1, -1):
        if stack.isEmpty():
            result.append(len(arr))
            stack.push([arr[i], i])
        elif not stack.isEmpty():
            while(not stack.isEmpty() and arr[i] <= stack.peek()[0]): # to check equal values
                stack.pop()
            if stack.isEmpty():
                result.append(len(arr))
            else:
                result.append(stack.peek()[1])
            stack.push([arr[i], i])

    result.reverse()
    return result

def nearestSmallerToLeft(arr):
    stack = Stack()
    result = []

    for i in range(0, len(arr)):
        if stack.isEmpty():
            result.append(-1)
            stack.push([arr[i], i])
        elif not stack.isEmpty():
            while(not stack.isEmpty() and arr[i] <= stack.peek()[0]): # to check equal values
                stack.pop()
            if stack.isEmpty():
                result.append(-1)
            else:
                result.append(stack.peek()[1])
            stack.push([arr[i], i])

    return result

def max_area_histogram(arr):
    NSL = nearestSmallerToLeft(arr)
    NSR = nearestSmallerToRight(arr)

    WIDTH = []

    for i in range(0, len(arr)):
        WIDTH.append(NSR[i] - NSL[i] - 1)

    AREA = []

    for i in range(0, len(arr)):
        AREA.append(arr[i] * WIDTH[i])

    return max(AREA)

arr = [6, 2, 5, 4, 5, 1, 6]

print(max_area_histogram(arr))
JavaScript
class Stack {
    constructor() {
        this.stack = [];
    }

    isEmpty() {
        return this.stack.length === 0;
    }

    push(num) {
        this.stack.push(num);
    }

    pop() {
        if (this.isEmpty())
            throw 'Stack underflow';
        return this.stack.pop();
    }

    peek() {
        if (this.isEmpty())
            return null;
        return this.stack[this.stack.length - 1];
    }
}

function nearestSmallerToRight(arr) {
    const stack = new Stack();
    const result = [];

    for (let i = arr.length; i >= 0; i--) {
        if (stack.isEmpty()) {
            result.push(arr.length);
            stack.push([arr[i], i]);
        } else if (!stack.isEmpty()) {
            while (!stack.isEmpty() && arr[i] <= stack.peek()[0]) {
                stack.pop();
            }
            if (stack.isEmpty()) {
                result.push(arr.length);
            } else {
                result.push(stack.peek()[1]);
            }
            stack.push([arr[i], i]);
        }
    }

    result.reverse();
    return result;
}

function nearestSmallerToLeft(arr) {
    const stack = new Stack();
    const result = [];

    for (let i = 0; i < arr.length; i++) {
        if (stack.isEmpty()) {
            result.push(-1);
            stack.push([arr[i], i]);
        } else if (!stack.isEmpty()) {
            while (!stack.isEmpty() && arr[i] <= stack.peek()[0]) {
                stack.pop();
            }
            if (stack.isEmpty()) {
                result.push(-1);
            } else {
                result.push(stack.peek()[1]);
            }
            stack.push([arr[i], i]);
        }
    }

    return result;
}

function max_area_histogram(arr) {
    const NSL = nearestSmallerToLeft(arr);
    const NSR = nearestSmallerToRight(arr);

    const WIDTH = [];

    for (let i = 0; i < arr.length; i++)
        WIDTH.push(NSR[i] - NSL[i] - 1);

    const AREA = []

    for (let i = 0; i < arr.length; i++)
        AREA.push(arr[i] * WIDTH[i]);

    return Math.max(...AREA);
}

const arr = [6, 2, 5, 4, 5, 1, 6];

console.log(max_area_histogram(arr));
Output
[-1, -1, 4, -1, 2]
Slightly better approach with less number of lines
Python
class Stack:
    def __init__(self):
        self.stack = []

    def isEmpty(self):
        return len(self.stack) == 0

    def push(self, num):
        self.stack.append(num)

    def pop(self):
        if self.isEmpty():
            raise Exception('Stack Underflow')
        return self.stack.pop()

    def peek(self):
        if self.isEmpty():
            return None
        return self.stack[-1]

def max_area_histogram(arr):
    stack = Stack()
    stack.push(-1)
    max_area = 0

    for i in range(len(arr)):
        while stack.peek() != -1 and arr[stack.peek()] >= arr[i]:
            last_element_index = stack.pop()
            max_area = max(max_area, arr[last_element_index] * (i - stack.peek() - 1))
        stack.push(i)

    while stack.peek() != -1:
        last_element_index = stack.pop()
        max_area = max(max_area, arr[last_element_index] * (len(arr) - stack.peek() - 1))

    return max_area

arr = [6, 2, 5, 4, 5, 1, 6]

print(max_area_histogram(arr))
JavaScript
class Stack {
    constructor() {
        this.stack = [];
    }

    isEmpty() {
        return this.stack.length === 0;
    }

    push(num) {
        this.stack.push(num);
    }

    pop() {
        if (this.isEmpty())
            throw 'Stack underflow';
        return this.stack.pop();
    }

    peek() {
        if (this.isEmpty())
            return null;
        return this.stack[this.stack.length - 1];
    }
}

function maxAreaHistogram(arr) {
    const stack = new Stack();
    stack.push(-1);
    maxArea = 0;

    for (let i = 0; i < arr.length; i++) {
        while (stack.peek() !== -1 && arr[stack.peek()] >= arr[i]) {
            lastElementIndex = stack.pop();
            maxArea = Math.max(maxArea, arr[lastElementIndex] * (i - stack.peek() - 1));
        }
        stack.push(i);
    }

    while (stack.peek() != -1) {
        lastElementIndex = stack.pop();
        maxArea = Math.max(maxArea, arr[lastElementIndex] * (arr.length - stack.peek() - 1));
    }

    return maxArea;
}

const arr = [6, 2, 5, 4, 5, 1, 6];

console.log(maxAreaHistogram(arr));